Solution · Risk appetite and decisions

See pressure before it becomes an isolated exception.

Connect risk appetite, financial indicators, thresholds, movements and dependencies for management decision support.

Coordinated solution

Risk becomes more useful when leaders can see connected movements and emerging pressure—not only whether one indicator crossed one line.

Connected to the mission
01Innotude mAItrix
02RAS.Next
03Decision Scientist

Interface glimpse

Current product screens, without the sensitive detail.

These current product captures use sanitised demonstration data. They show product quality and operating structure while keeping client records, internal prompts and proprietary orchestration private.

15 reviewed product captures · sanitised demo data · no client records
RAS.Next
current product capturesanitised demo data

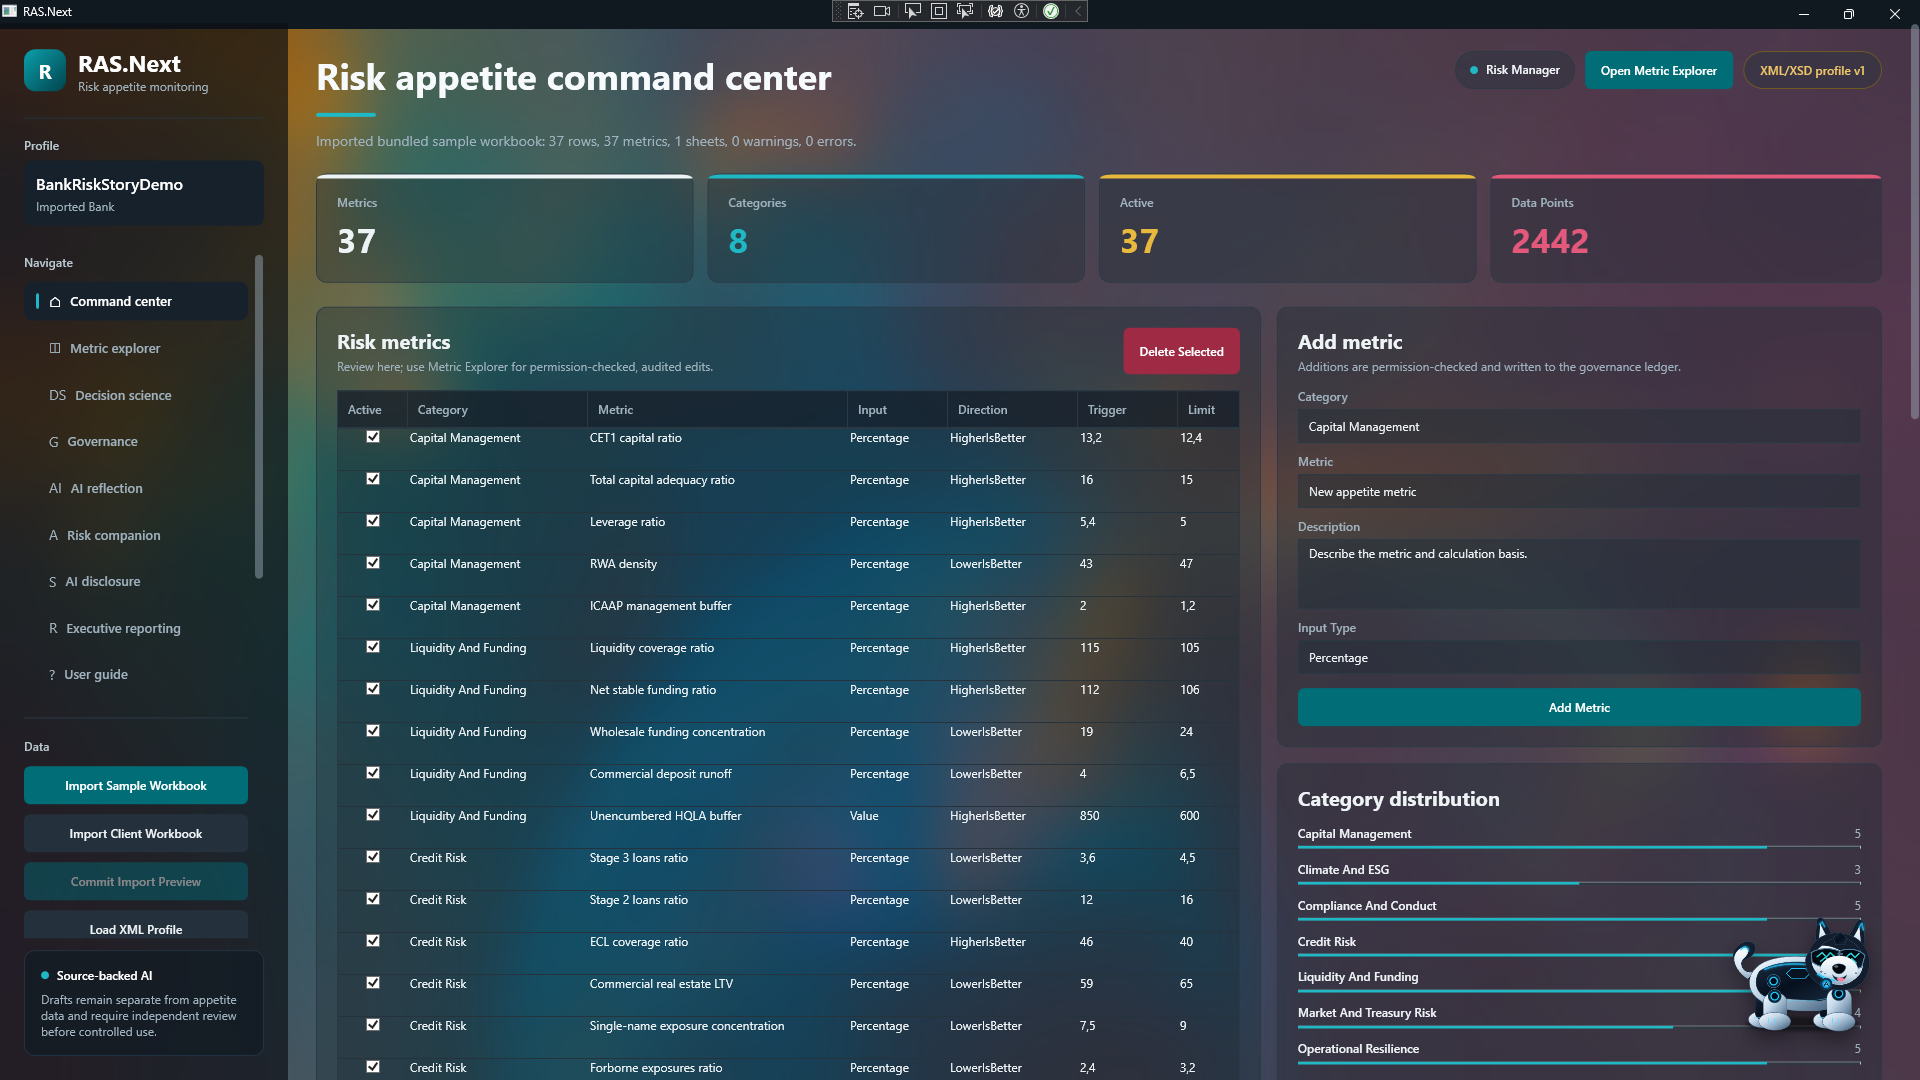
RAS.Next

Risk appetite is monitored as a connected operating system.

The Command Centre brings posture, movements and areas of pressure into one executive decision-support surface.
  • Risk appetite
  • Command Centre
  • Connected pressure
RAS.Next
current product capturesanitised demo data

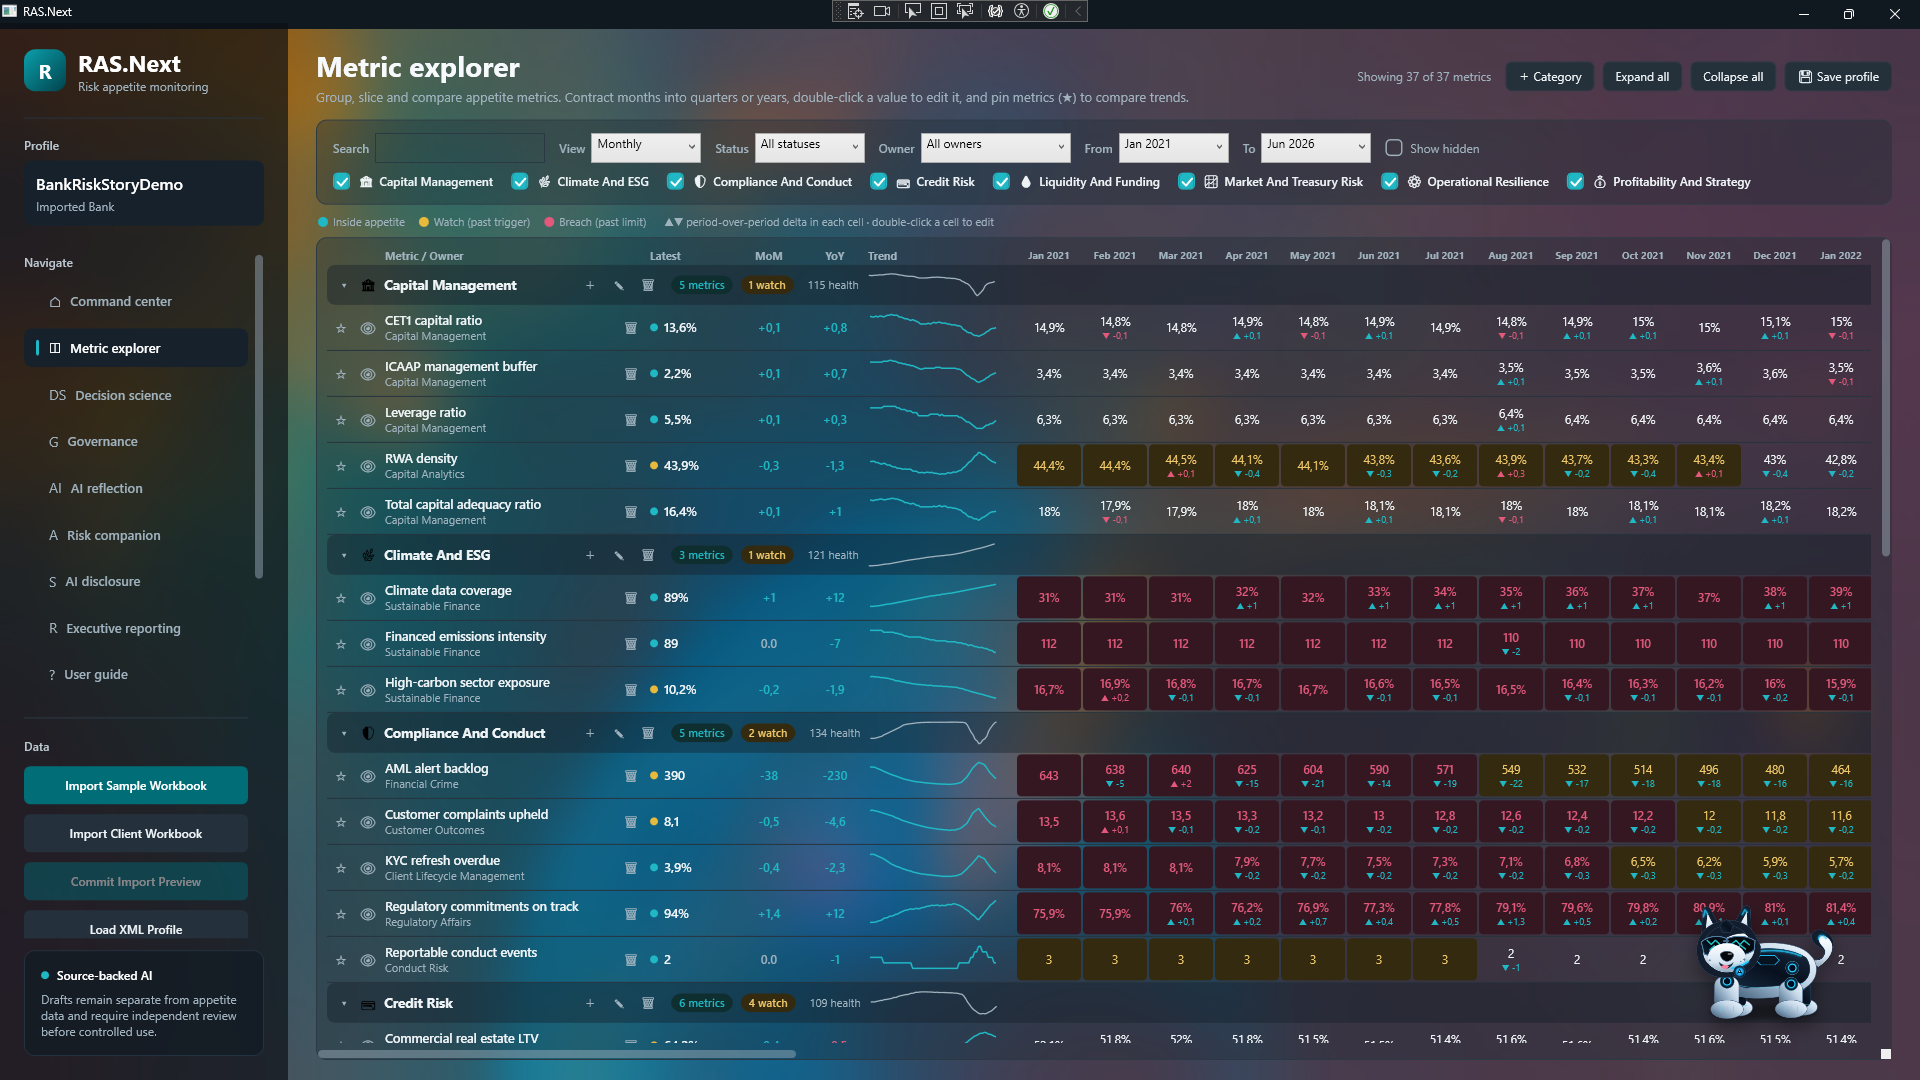
RAS.Next

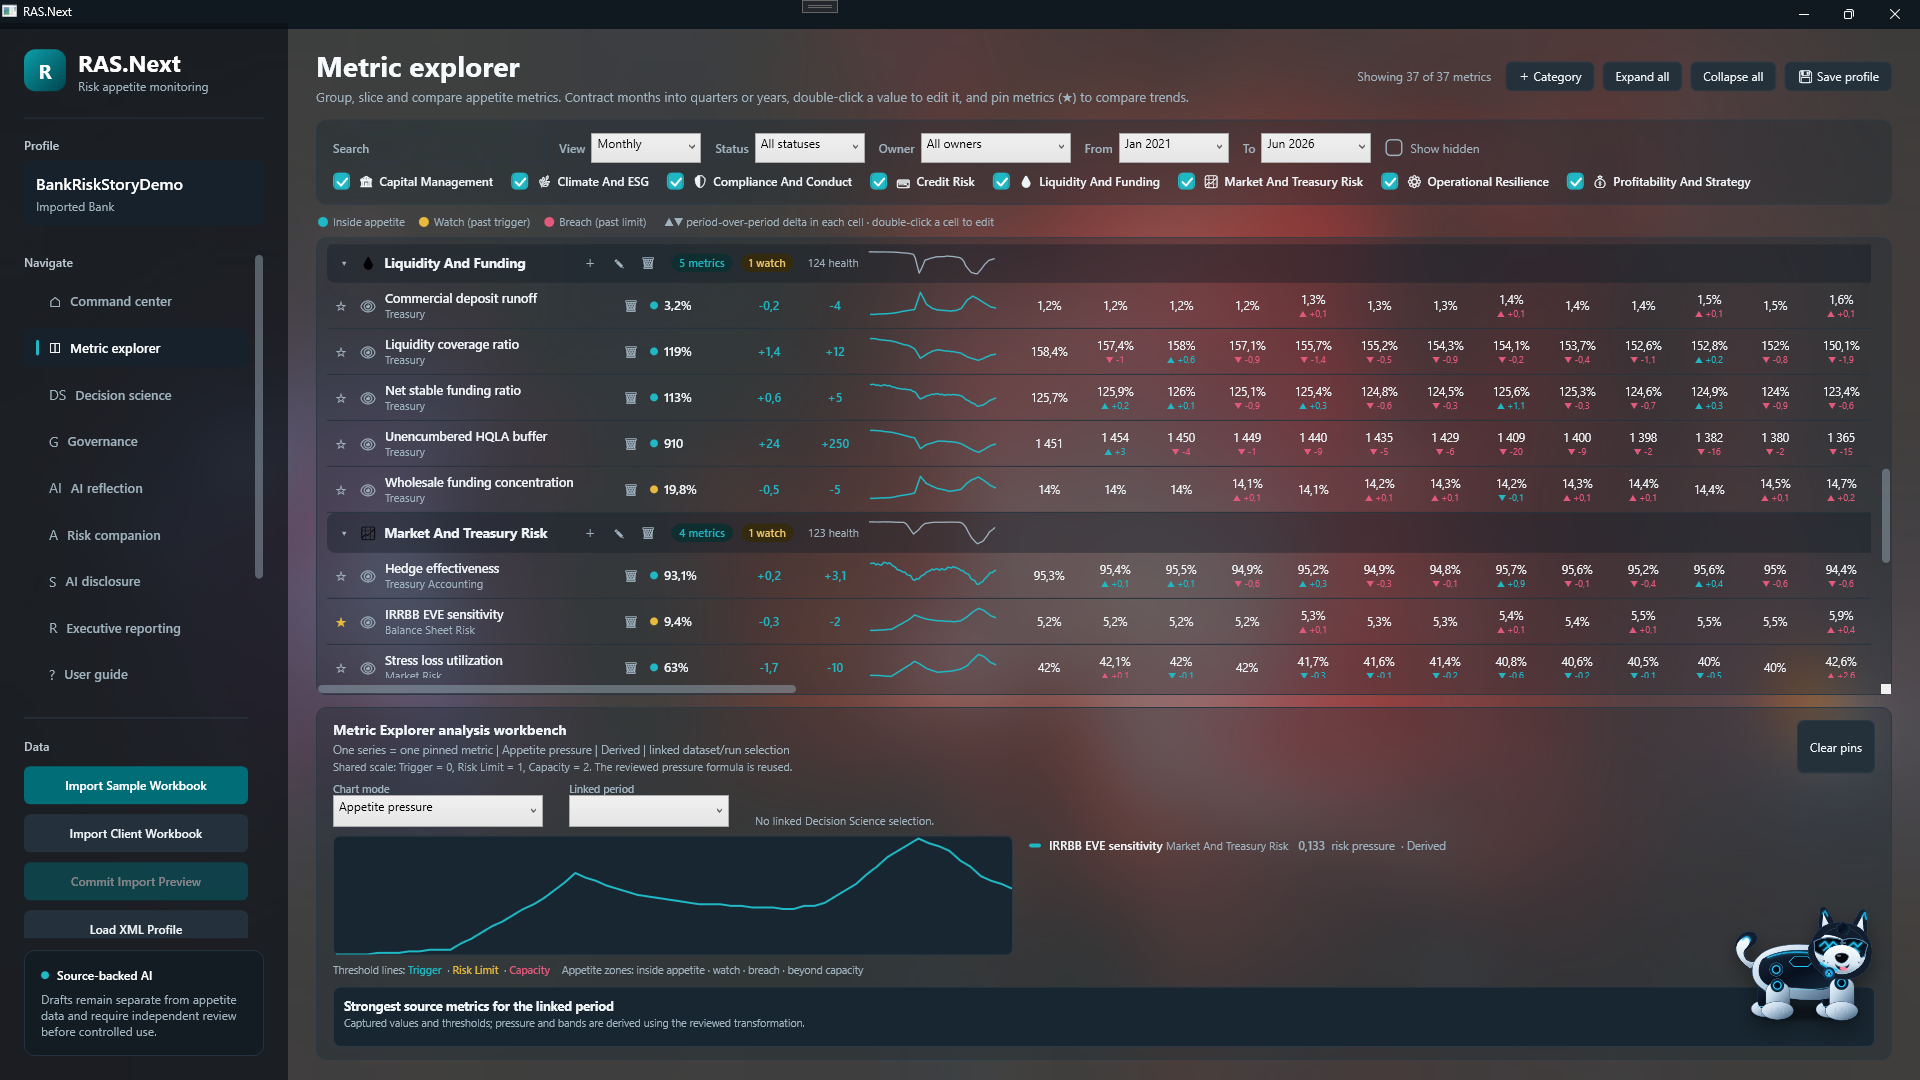
Thirty-seven sample indicators become a field of pressure.

The Metric Explorer contracts years of observations into a governed view of thresholds, movement and appetite.
  • 37 sample metrics
  • 66 periods
  • Appetite movement
RAS.Next
current product capturesanitised demo data

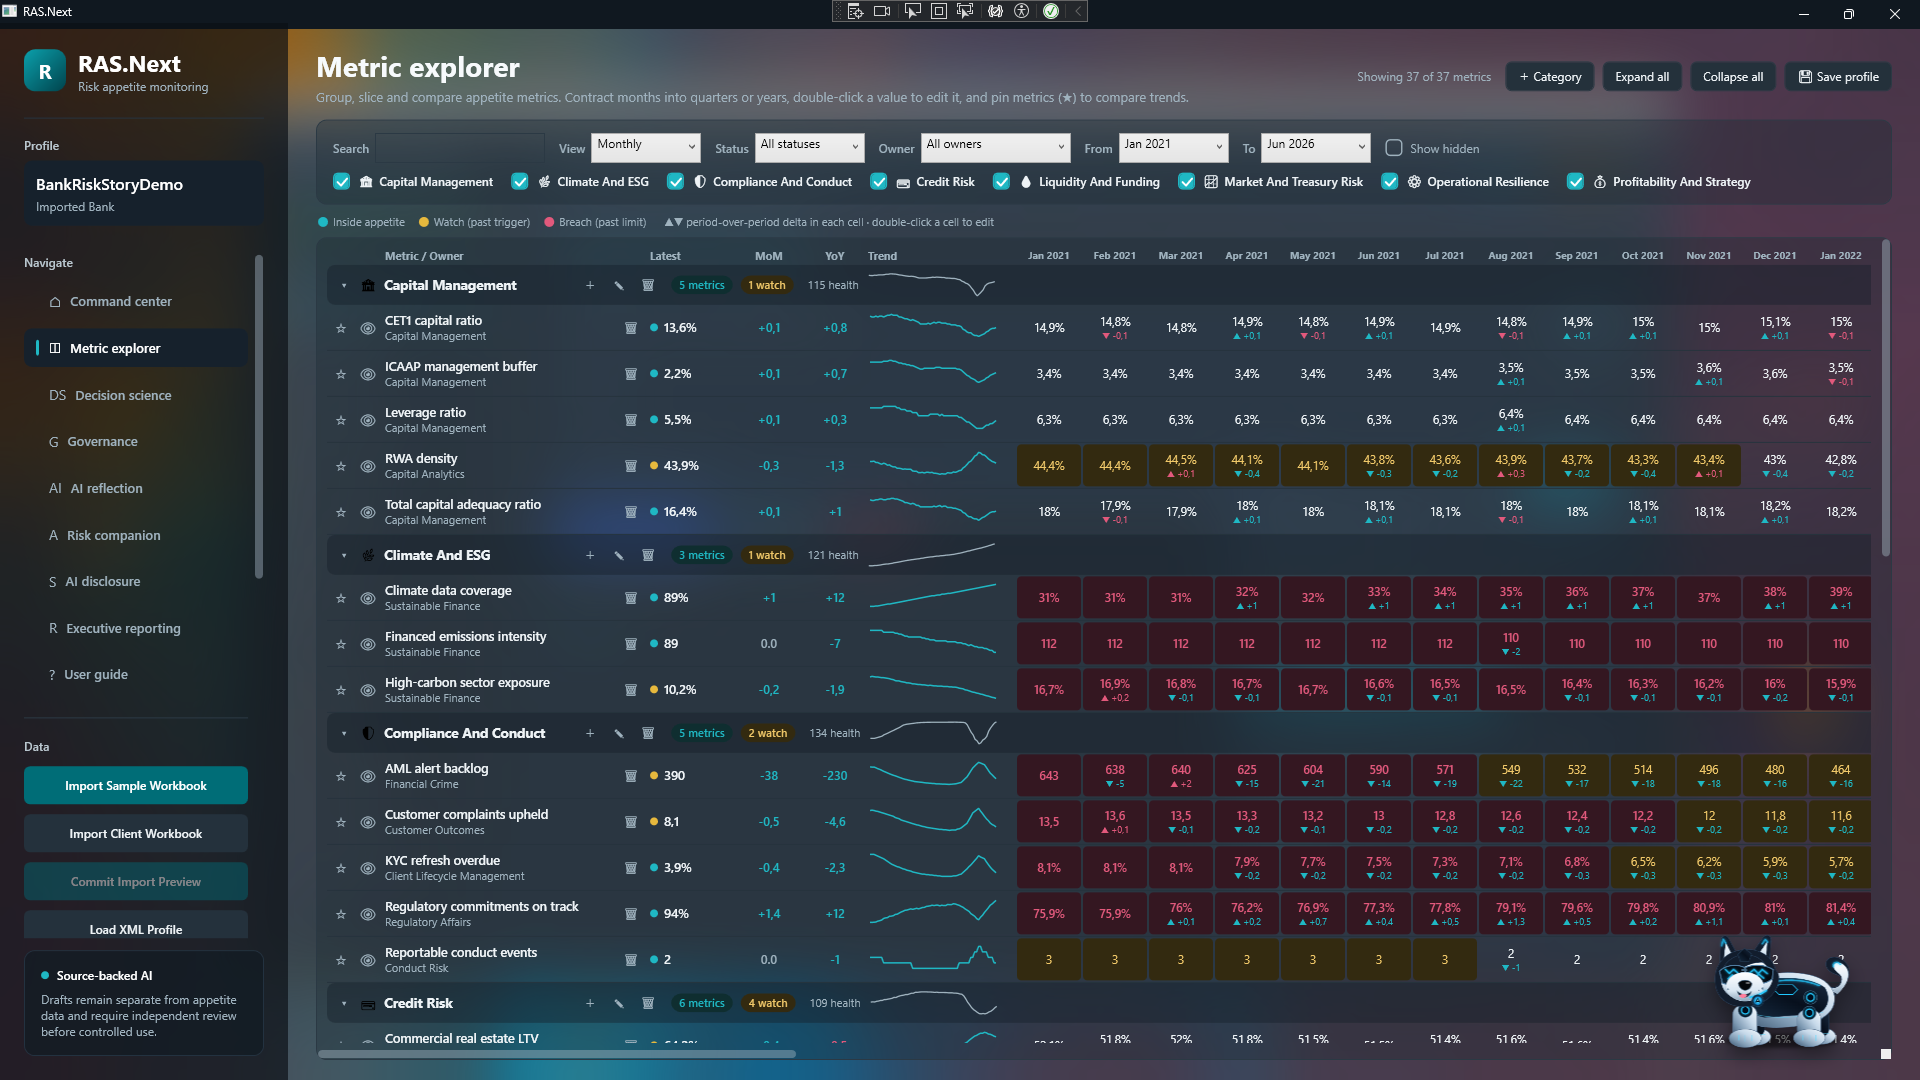
RAS.Next

Metric families can be expanded without losing the system view.

Operators can inspect connected categories and periods while retaining overall appetite context.
  • Metric families
  • Time series
  • System view
RAS.Next
current product capturesanitised demo data

RAS.Next

A single indicator can be examined in context.

Detail views connect movement, threshold history and ownership to the wider risk story.
  • Indicator detail
  • Threshold history
  • Ownership
RAS.Next
current product capturesanitised demo data

RAS.Next

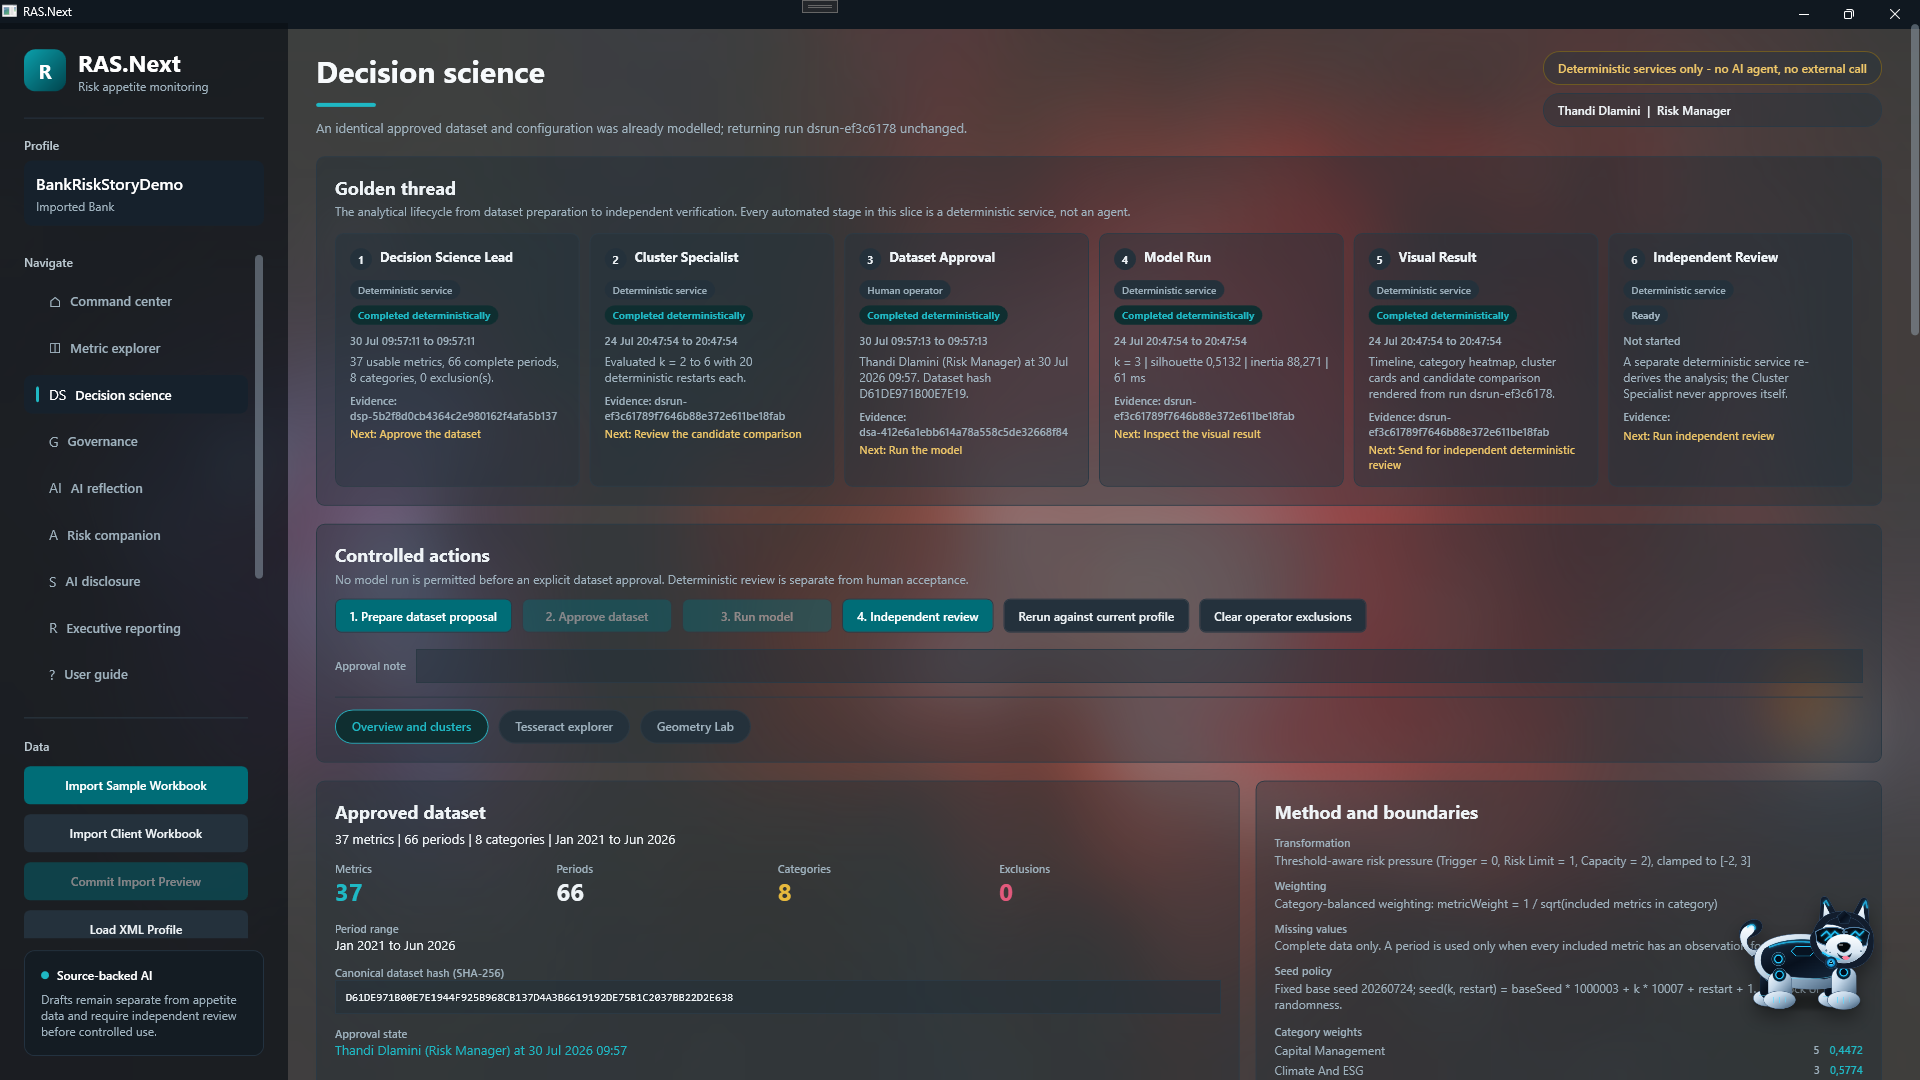
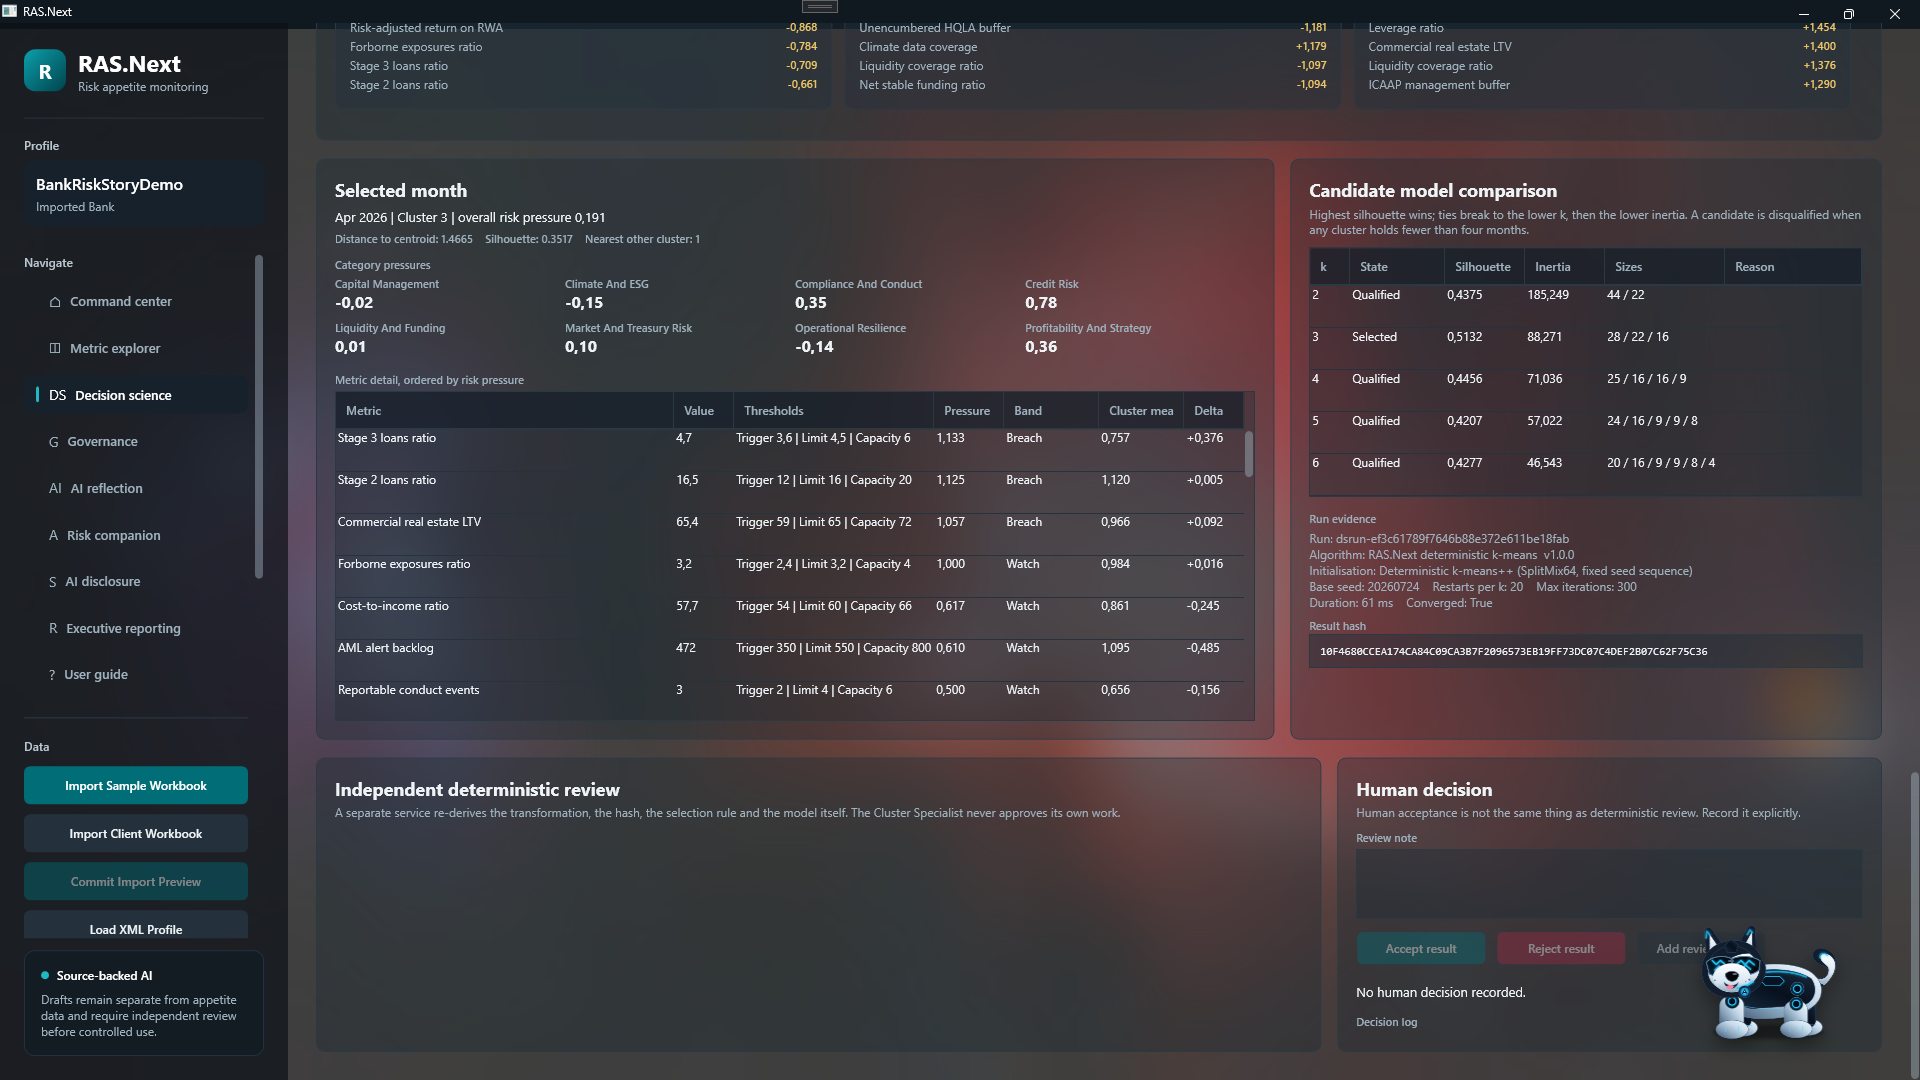
Decision science follows an explicit golden thread.

The workflow makes dataset choice, method proposal, approval, execution and interpretation visible as separate governed steps.
  • Golden thread
  • Method proposal
  • Interpretation
RAS.Next
current product capturesanitised demo data

RAS.Next

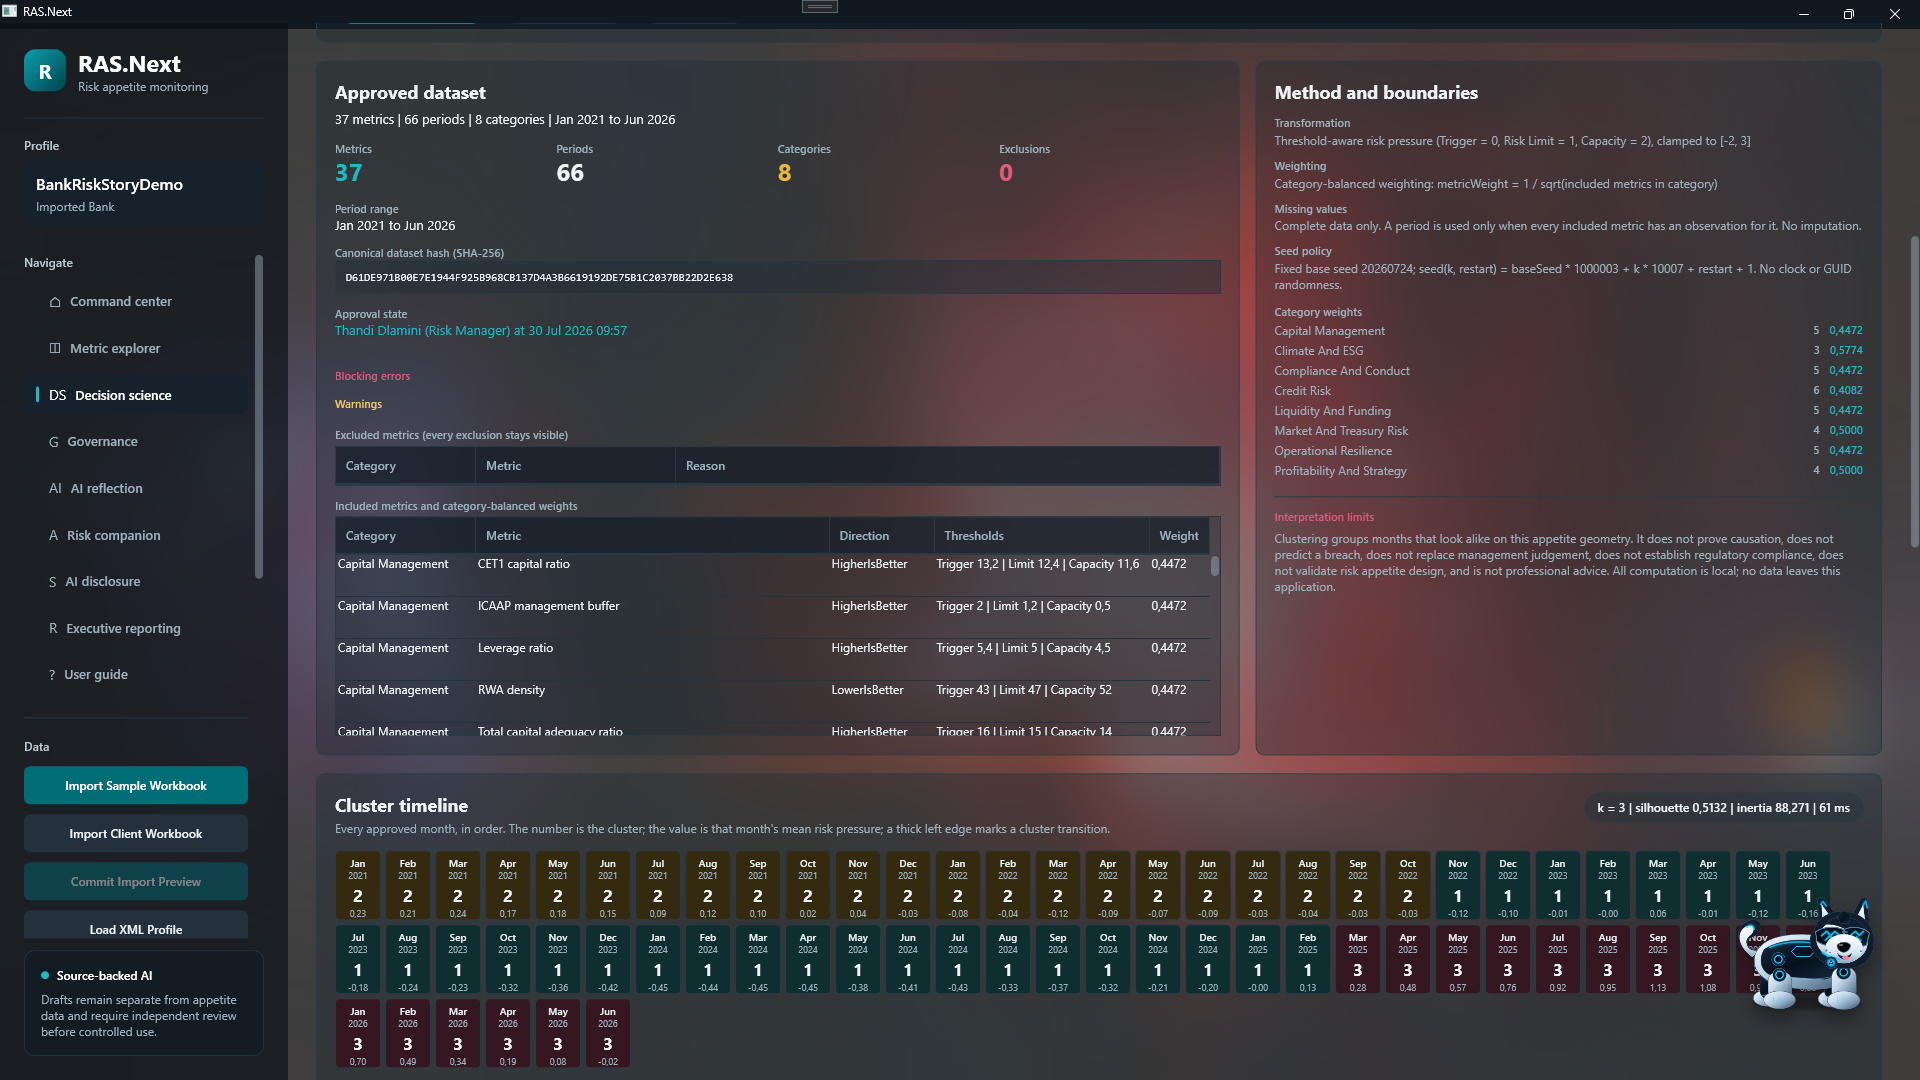
Dataset and method approval precede model execution.

A decision scientist can prepare a method, but a recorded human decision remains the boundary for controlled use.
  • Dataset approval
  • Method approval
  • Human boundary
RAS.Next
current product capturesanitised demo data

RAS.Next

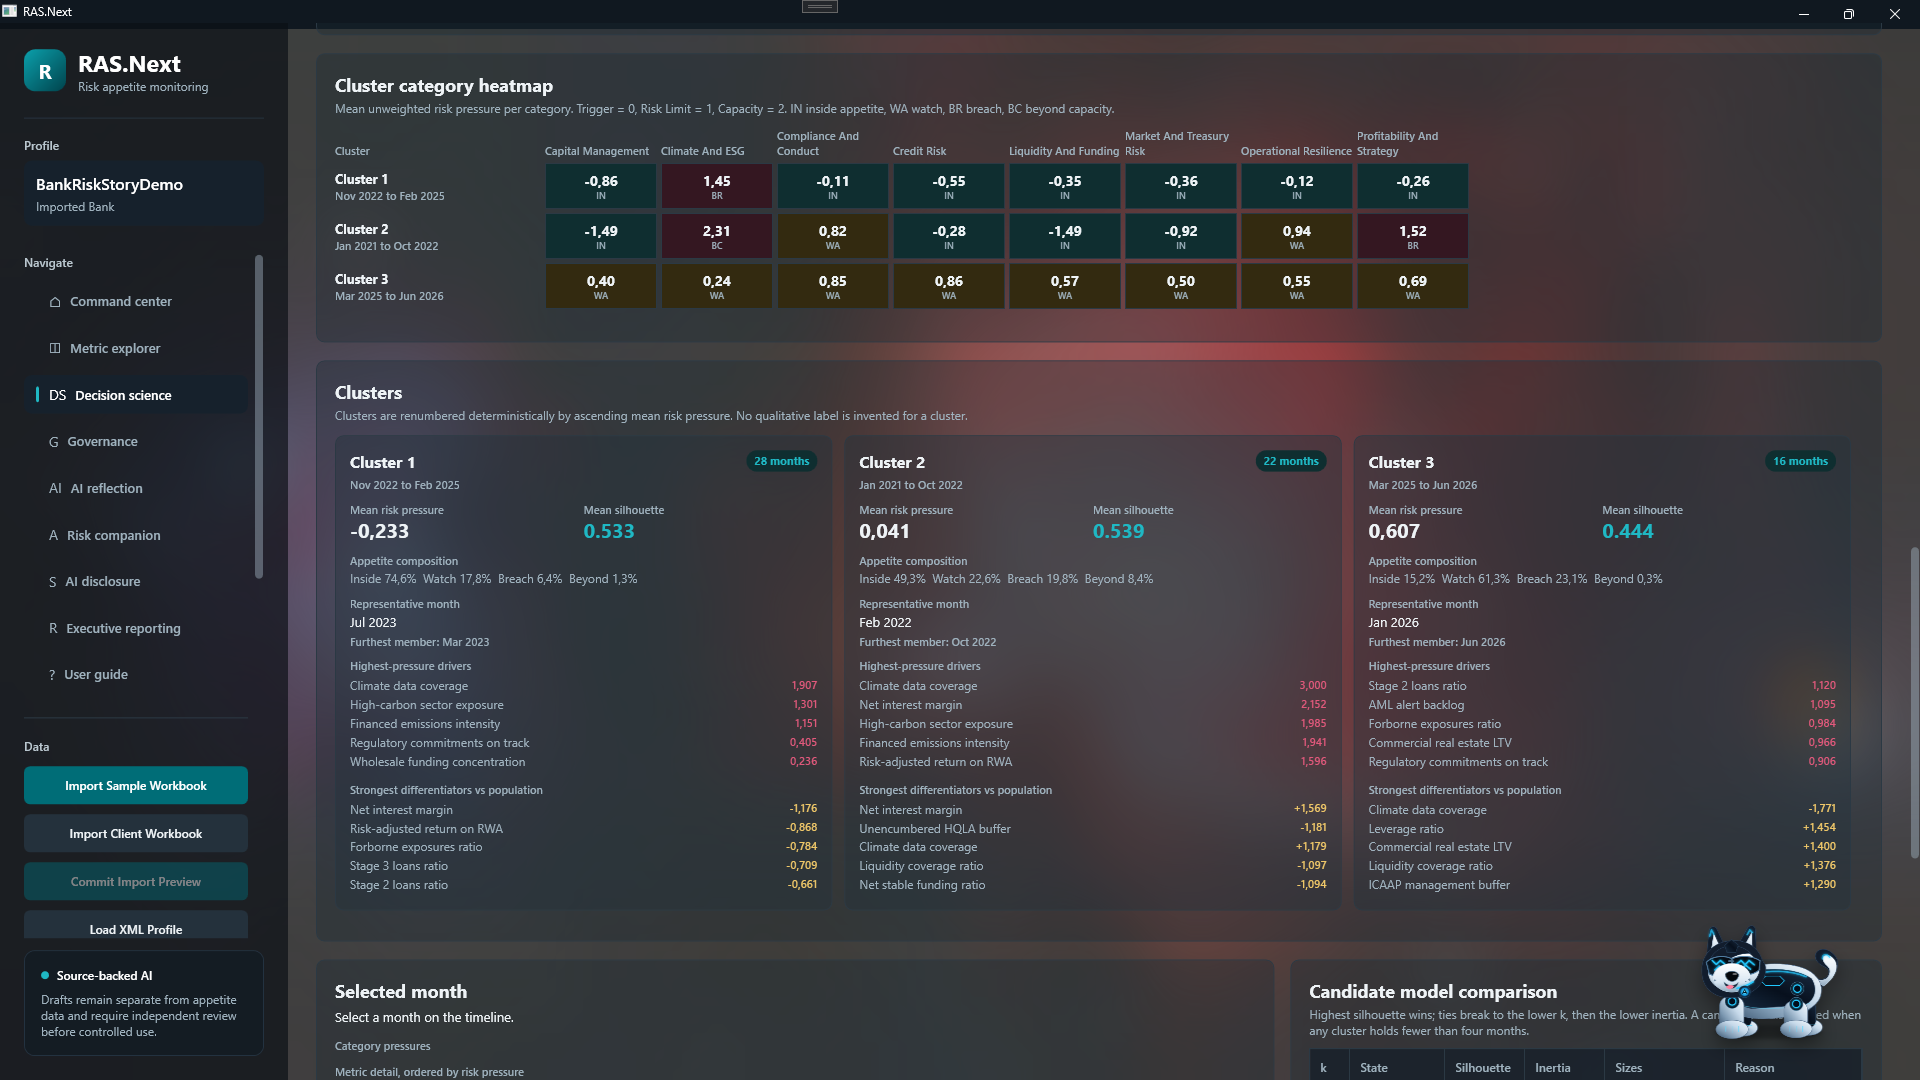
Multidimensional patterns become inspectable.

Cluster and category views surface relationships that may be missed in one-indicator-at-a-time monitoring.
  • Clustering
  • Heatmap
  • Multidimensional pattern
RAS.Next
current product capturesanitised demo data

RAS.Next

Candidate groupings are presented for judgement.

The system distinguishes an analytical candidate from an approved management interpretation.
  • Candidate groups
  • Human judgement
  • Interpretation
RAS.Next
current product capturesanitised demo data

RAS.Next

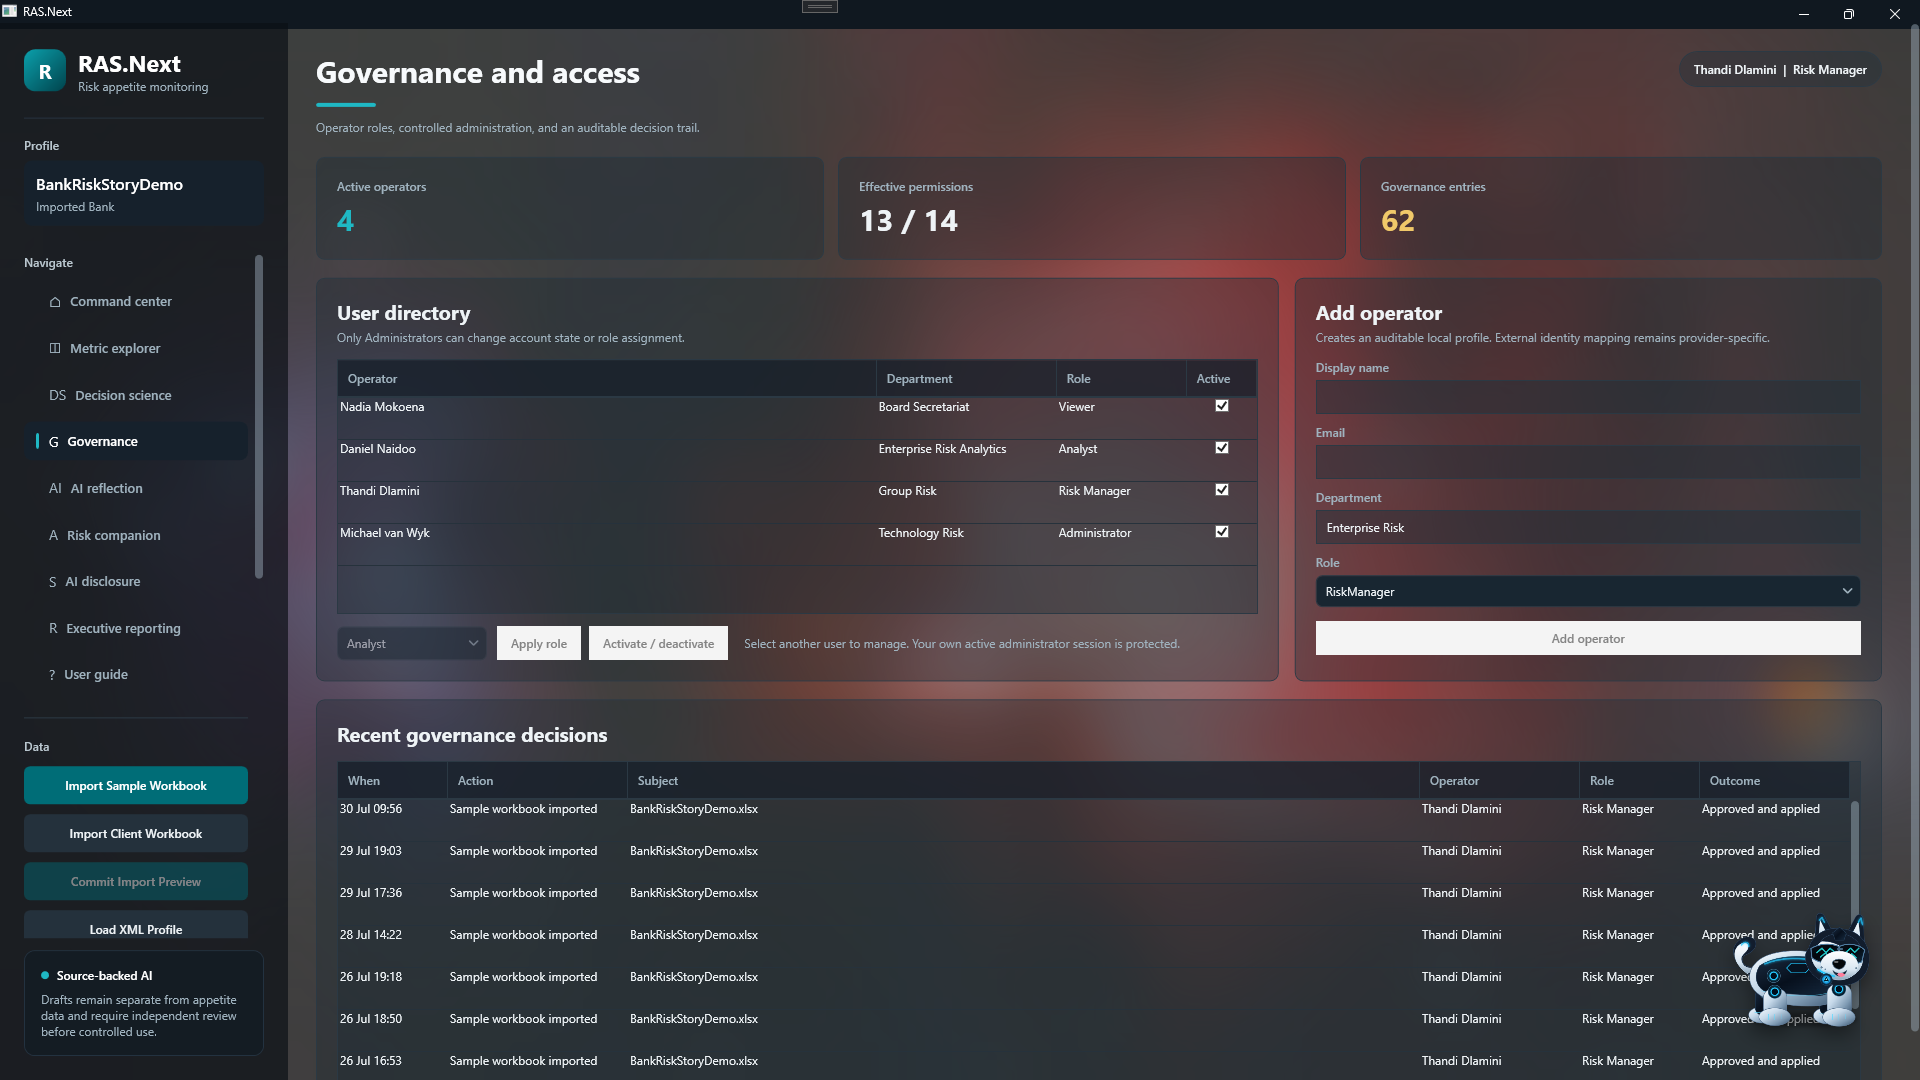
Access and governance remain visible in the workspace.

Controlled use, responsibilities and relevant governance posture are available alongside the analytical work.
  • Access
  • Governance
  • Responsibilities
RAS.Next
current product capturesanitised demo data

RAS.Next

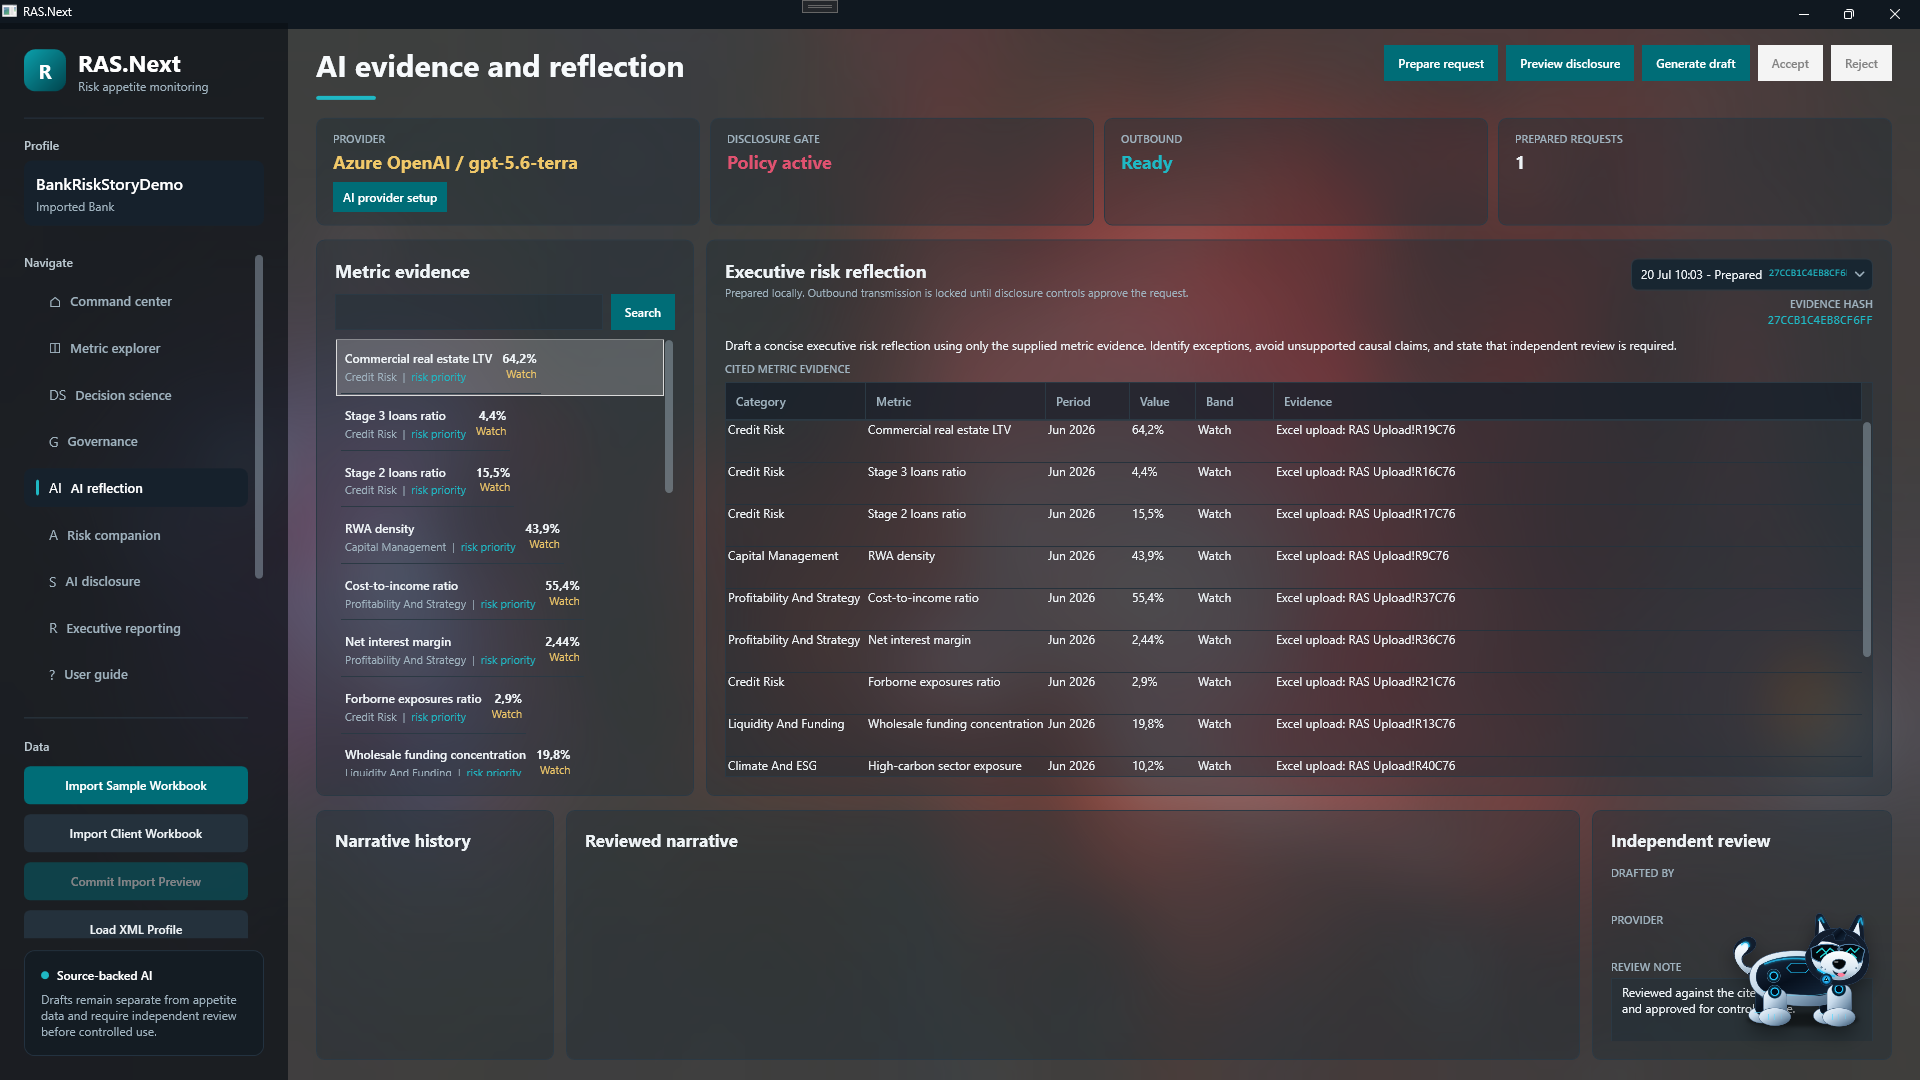
AI reflection carries an evidence boundary.

The workspace separates source-backed interpretation from human review and avoids presenting generated narrative as appetite data.
  • AI evidence
  • Source-backed
  • Review boundary
RAS.Next
current product capturesanitised demo data

RAS.Next

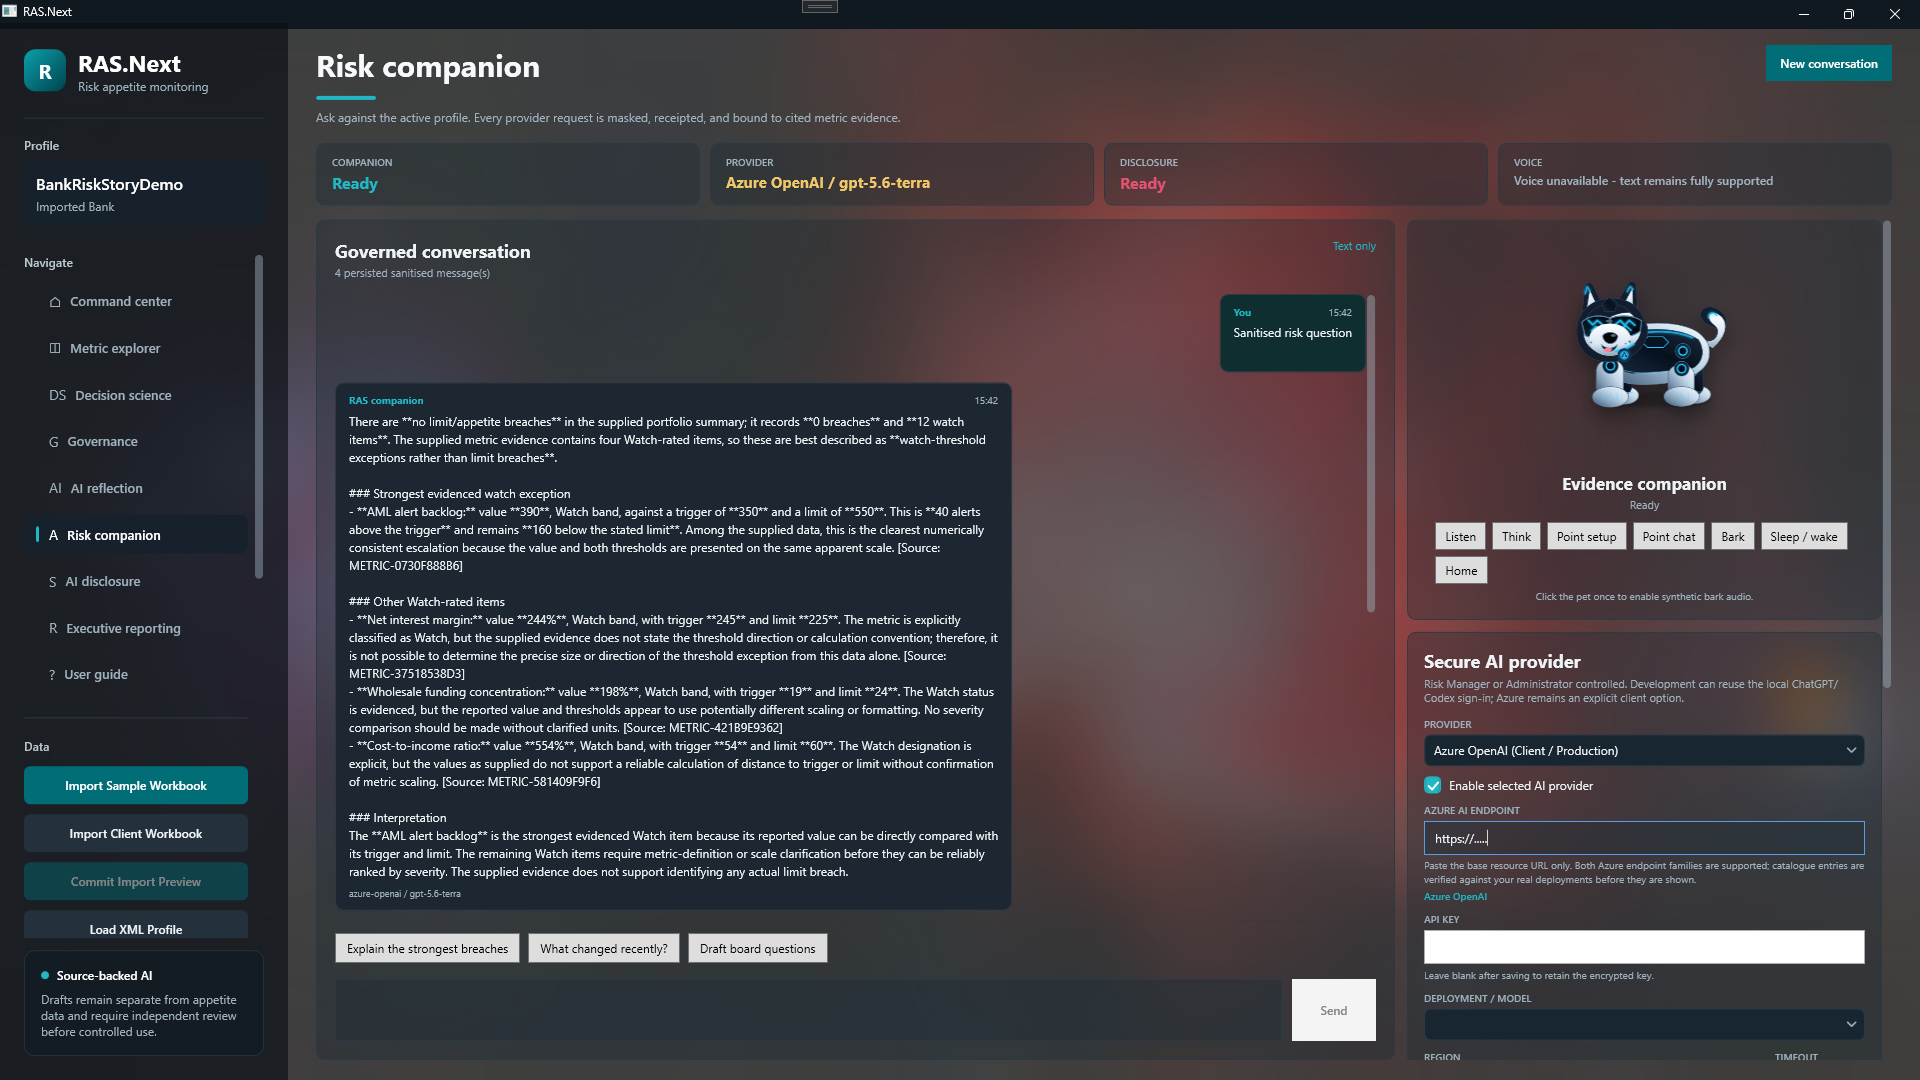
The risk companion supports—not replaces—management judgement.

Guidance remains connected to the risk system, its current evidence and the user’s decision responsibility.
  • Risk companion
  • Guidance
  • Management judgement
RAS.Next
current product capturesanitised demo data

RAS.Next

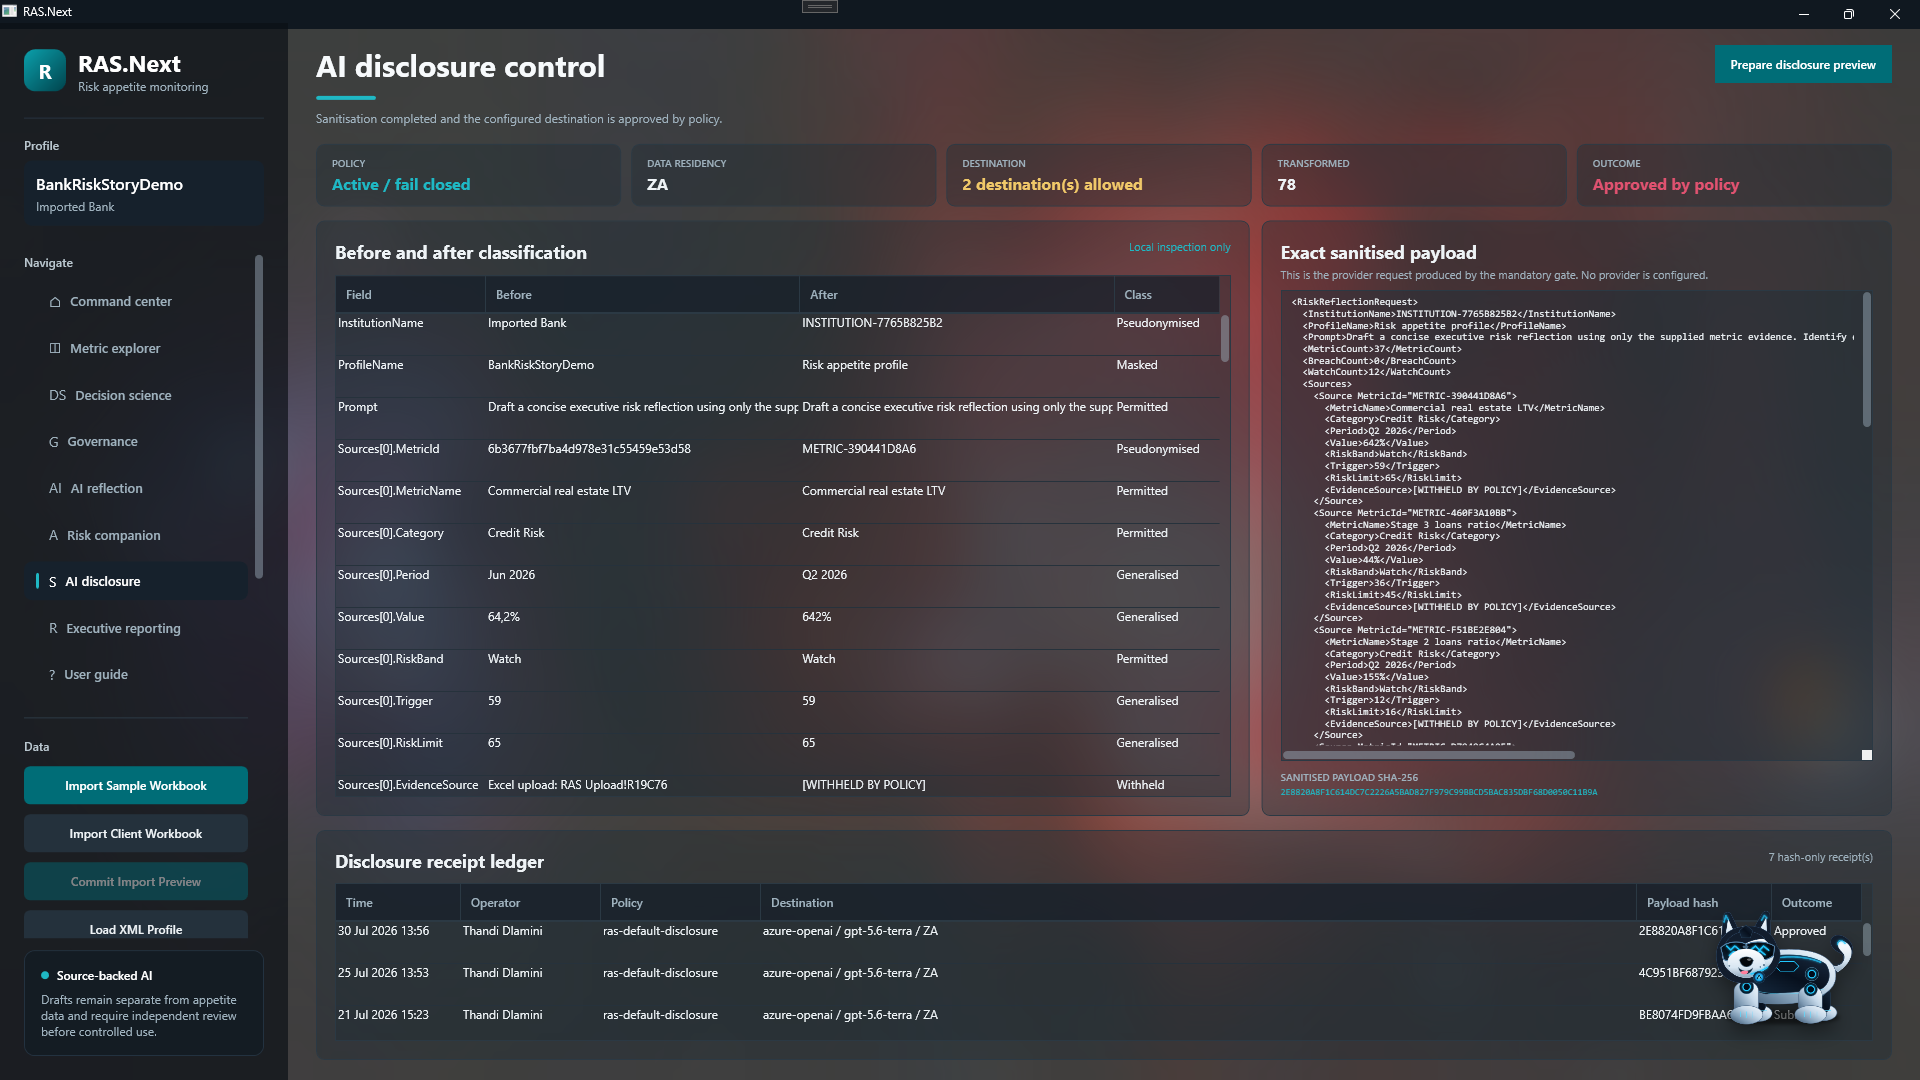
AI disclosure is an explicit control surface.

The workspace makes the role and boundary of AI visible so generated support is not confused with approved appetite data.
  • AI disclosure
  • Transparency
  • Control
RAS.Next
current product capturesanitised demo data

RAS.Next

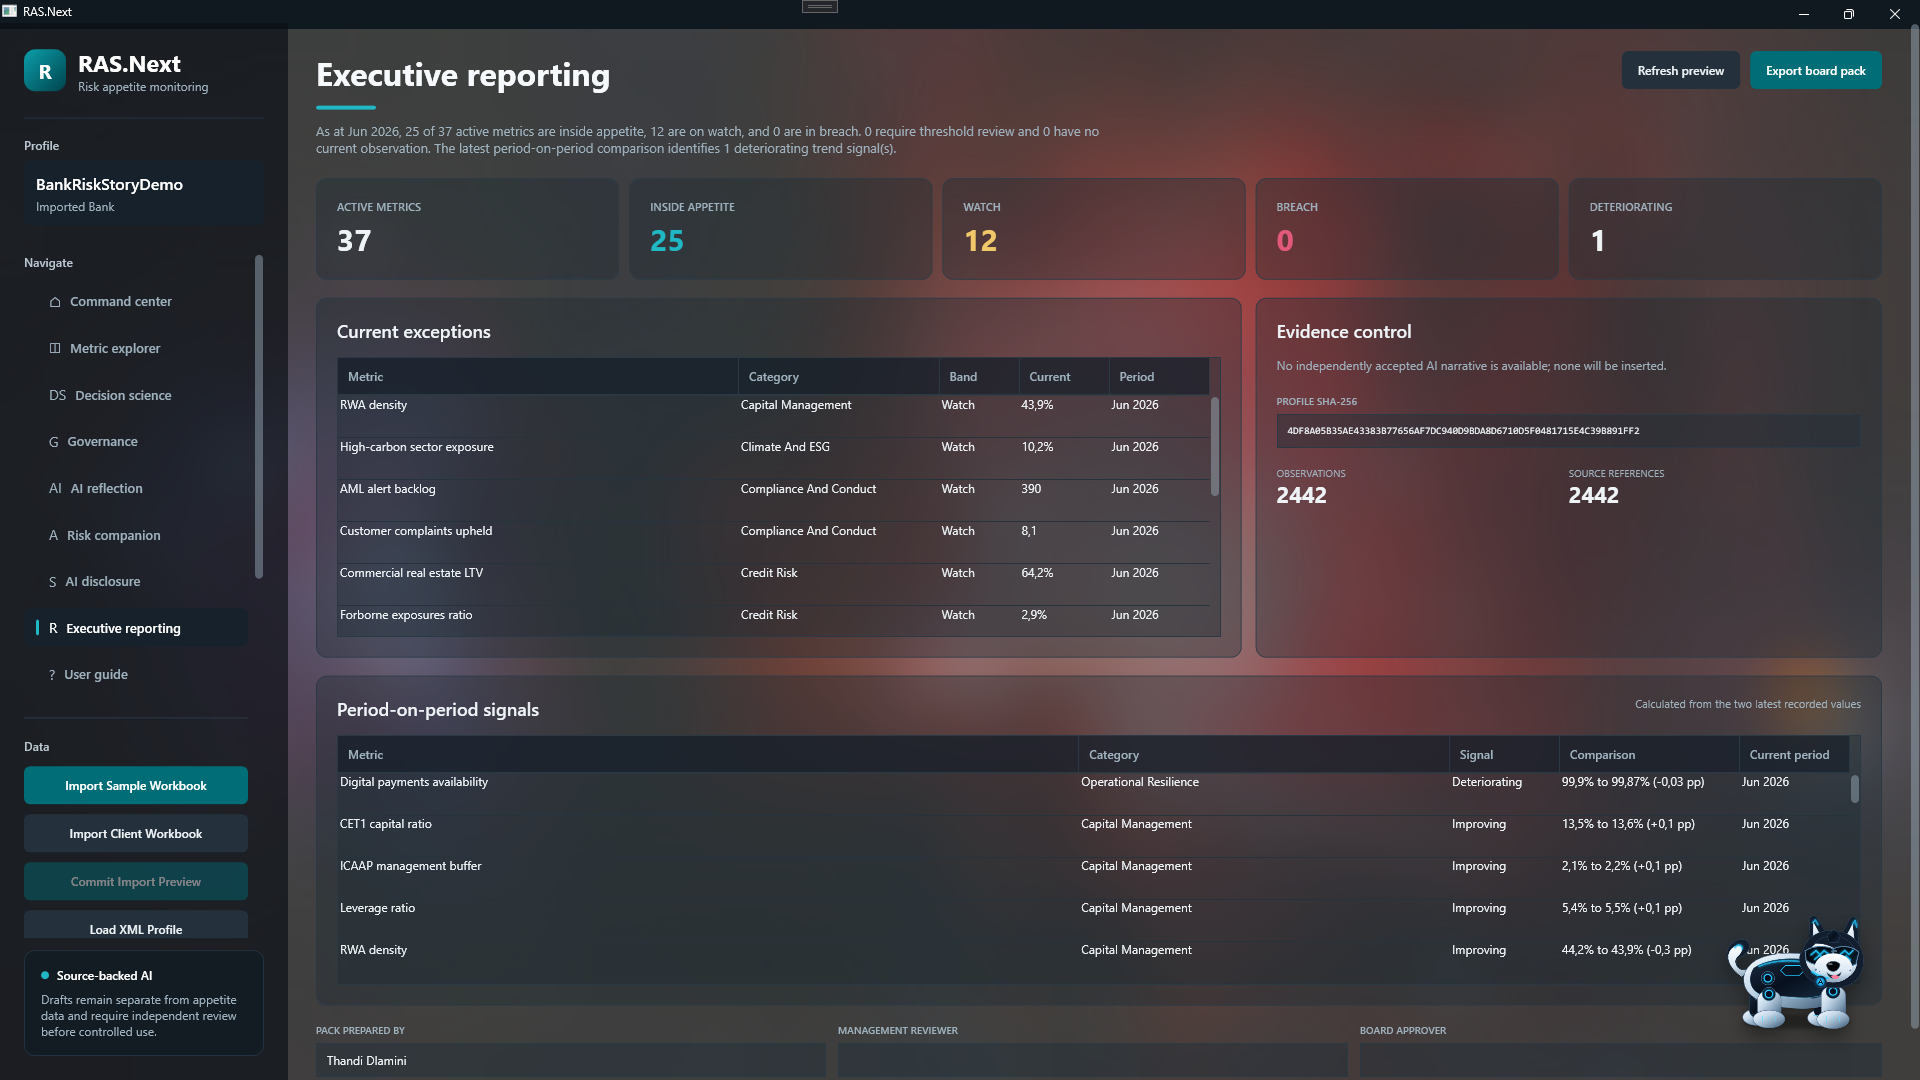
Executive reporting remains connected to the underlying system.

Decision-ready summaries can be produced without severing the relationship to indicators, thresholds and analytical context.
  • Executive reporting
  • Decision support
  • Traceability
RAS.Next
current product capturesanitised demo data

RAS.Next

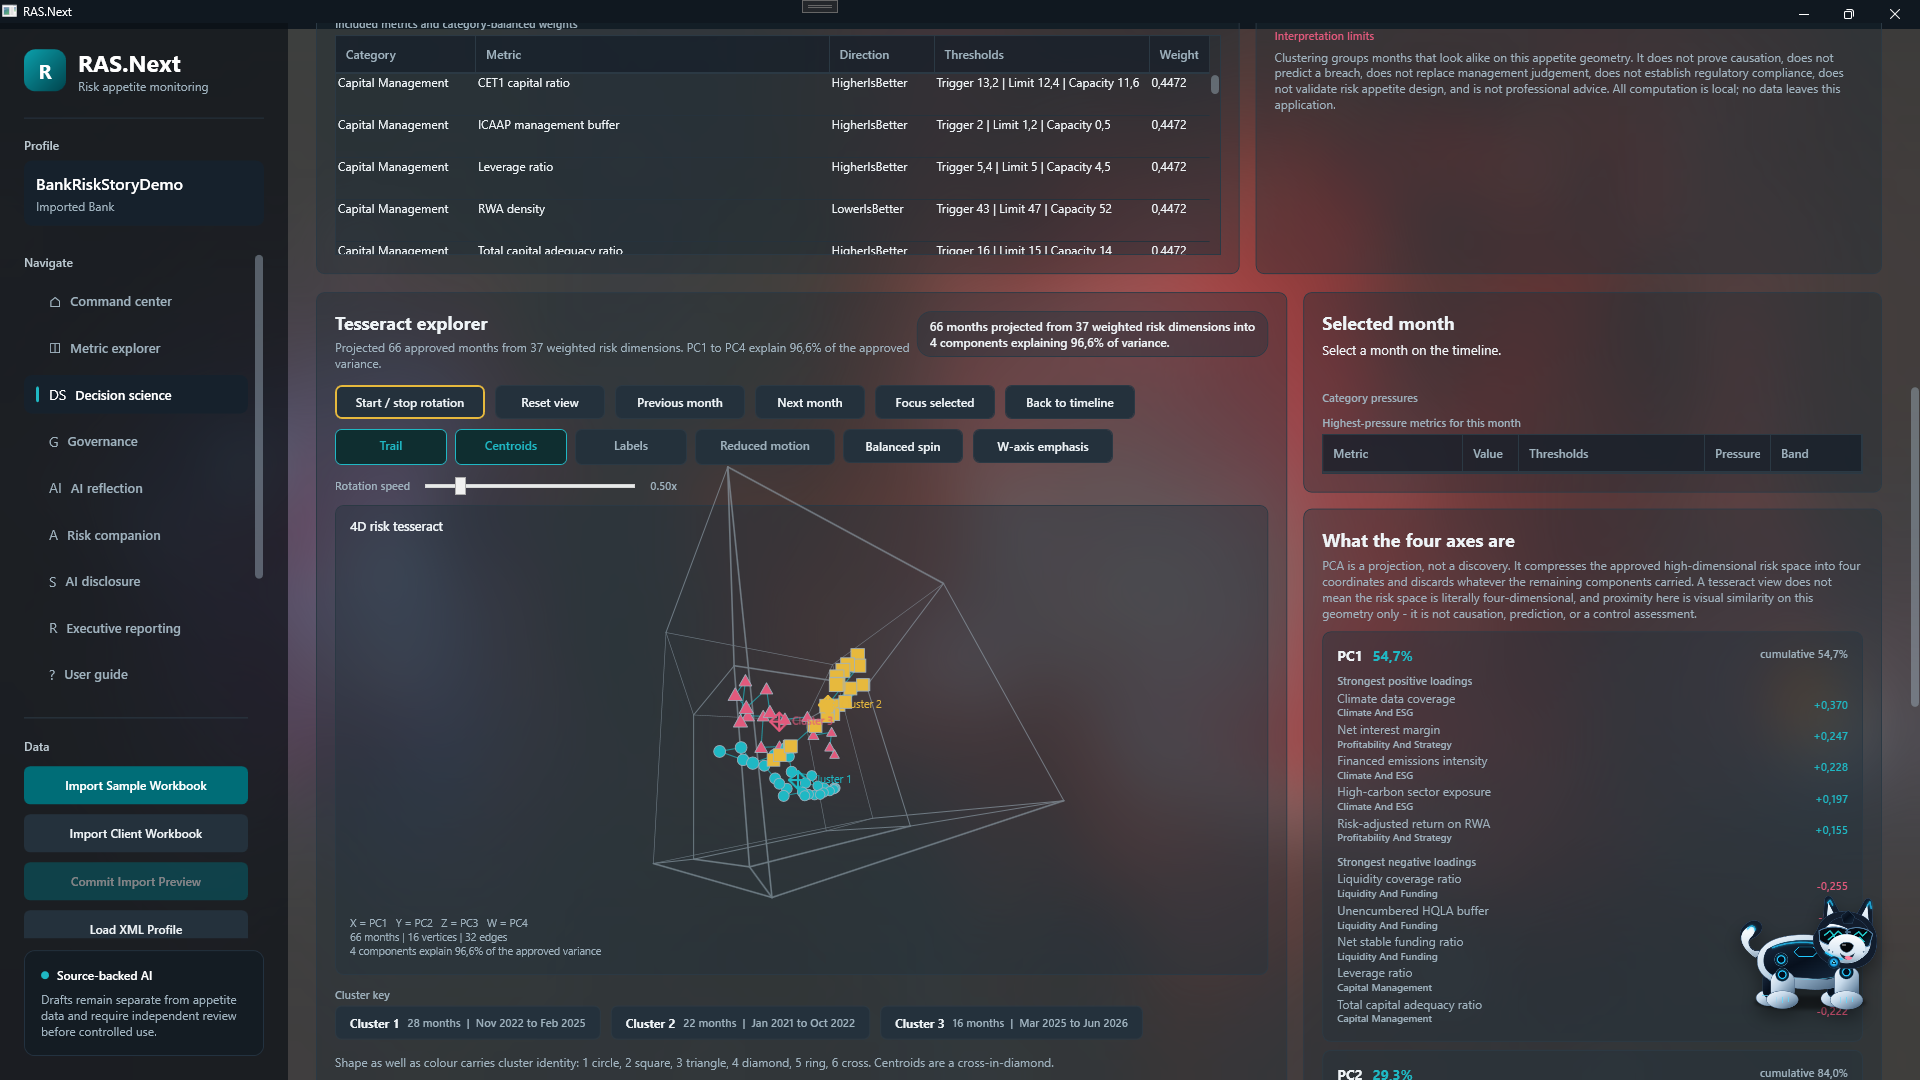
A 4D tesseract opens a governed multidimensional lens.

The explorer gives advanced users a visual instrument for connected pressure across four analytical dimensions.
  • 4D tesseract
  • Multidimensional
  • Risk system
RAS.Next
current product capturesanitised demo data

RAS.Next

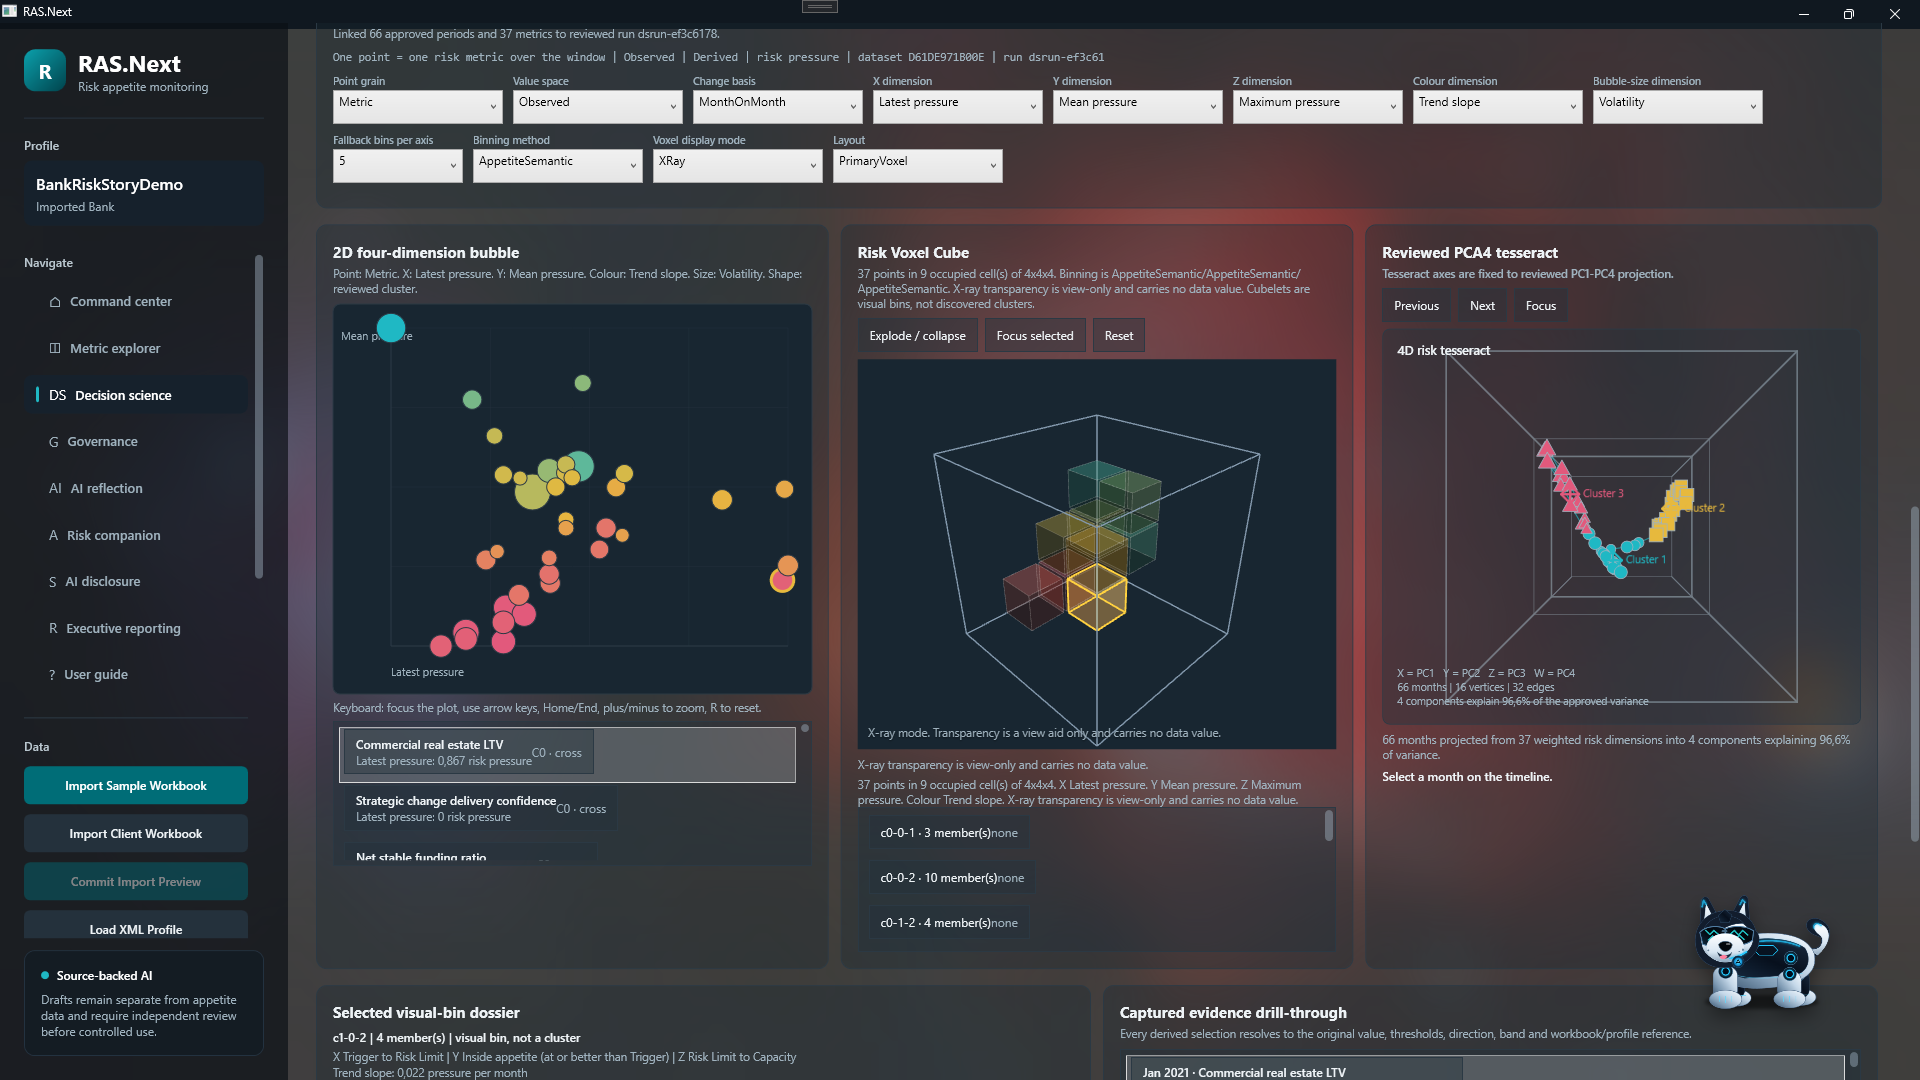
The Geometry Lab compares complementary analytical views.

Bubble, voxel and PCA-style projections help decision scientists interrogate structure without treating one visualisation as the answer.
  • Geometry Lab
  • Voxel
  • Comparative views

01 · Coordinated solution

Connect appetite to observation

RAS.Next brings appetite statements, indicators, thresholds and movement into the same decision-support context.

02 · Coordinated solution

Use the appropriate analytical instrument

Decision Scientist profiles can apply time-series and multidimensional methods when the question requires them, while preserving assumptions and limits.

  • Relate indicators to appetite and thresholds.
  • Trace dependencies between signals.
  • Explore multidimensional patterns.
  • Support management interpretation and action.

03 · Coordinated solution

Stay inside the right problem

This solution focuses on risk appetite, financial indicators and business pressure. Assurance transaction testing remains within the audit and assurance solution.

Private demonstration

Follow a governed mission end to end.

Start a serious conversation